


At ForteNext, we’ve led B2B Commerce Cloud implementations for more than two decades, helping clients track what really matters after go-live.
The following 30 KPIs represent the backbone of a mature measurement framework spanning customer experience, sales alignment, and operational excellence.
Each one tells a piece of the story: whether your platform is delivering value, empowering users, and creating long-term business impact.
In B2B commerce, every second spent waiting on a quote can mean a lost deal. Salesforce Commerce Cloud and CPQ (Configure, Price, Quote) tools help automate complex pricing and stock lookups.
Tracking average response time to customer inquiries ensures that your sales and service teams are using the platform to its full advantage.
Faster response times improve customer confidence, reduce churn risk, and increase quote-to-order conversion.
Response Time = Total Time to Respond ÷ Number of Inquiries
TTV measures how quickly the business begins realizing measurable benefits after go-live. In Commerce Cloud projects, that might be the first successful self-service order, automated quote approval, or integrated inventory sync.
A shorter TTV reflects good project scoping, efficient data migration, and effective training. Tracking this metric across business units helps leadership quantify early success and build internal momentum.
For B2B sellers, the relationship doesn’t end at checkout - it’s renewed with every reorder. CLV quantifies the total expected revenue from a customer over time.
With Salesforce, CLV can be enriched by service data, contract renewals, and usage analytics. Rising CLV post-implementation is the best proof that Commerce Cloud is not just capturing transactions but cultivating loyalty.
CLV = (Average Purchase Value × Purchase Frequency × Customer Lifespan)
In B2B, order values can fluctuate based on contract pricing, bulk tiers, or reorder cadence. AOV reveals whether upselling, product recommendations, or bundle configurations are performing as intended.
Salesforce Commerce Cloud’s AI-driven Einstein recommendations can directly impact AOV by suggesting complementary items or volume upgrades.
AOV = Total Revenue ÷ Number of Orders
Conversion rate shows how well your storefront turns interest into orders. In Salesforce Commerce Cloud, it’s often segmented by channel (direct, partner, portal) or buyer type.
Improving conversion may mean streamlining checkout steps, reducing approval delays, or integrating ERP-driven pricing in real time. Monitoring conversion over time ensures that technical improvements align with real customer behavior.
Conversion Rate = (Number of Conversions ÷ Total Visitors) × 100
Even in B2B, where orders are larger and more deliberate, abandonment still occurs - often due to missing approvals, unclear freight costs, or unavailable credit terms.
Tracking this KPI highlights friction points in the buyer journey. Salesforce Journey Builder can automate cart recovery emails or route stalled quotes back to sales for follow-up.
Cart Abandonment Rate = (Carts Created - Completed Purchases) ÷ Carts Created × 100
Organic traffic shows how visible your Commerce Cloud site has become post-launch. Integrating Salesforce CMS with GA4 or Search Console enables month-over-month comparisons.
Steady organic growth signals effective SEO, strong content, and better discoverability of product catalogs or knowledge articles - critical for driving self-service adoption.
B2B buying journeys are long and complex. Attribution accuracy tracks how reliably your Salesforce data identifies which channels and campaigns influence conversion.
Improving this metric ensures marketing investments are directed to the right touchpoints and helps align teams on shared revenue metrics.
B2B buyers expect B2C-quality experiences - personalized dashboards, contract pricing, and relevant recommendations. Tracking how users engage with personalized versus generic content (CTR, time on page, repeat visits) shows whether your data model and segmentation rules are working. Increased engagement is often one of the first visible signs of Commerce Cloud maturity.
No KPI captures sentiment more directly than CSAT. Through integrated Service Cloud surveys or Experience Cloud feedback forms, you can measure customer satisfaction after purchases, support interactions, or delivery milestones.
Rising CSAT post-implementation is a strong indicator that digital self-service is improving, not frustrating, the buyer journey.
CSAT = (Sum of Ratings ÷ Total Responses) × 100
In B2B, Commerce Cloud often integrates with Salesforce Marketing Cloud or Pardot to generate and nurture leads. Tracking MQLs helps evaluate whether the storefront attracts decision-makers who fit your ideal customer profile.
Improved MQL quality means your digital channel is becoming a lead engine, not just an order portal.
The MQL-to-SQL conversion rate reveals how aligned marketing and sales are on qualification criteria. In B2B Commerce implementations, it also tests whether CRM integrations are flowing correctly, ensuring leads triggered by web activity appear instantly in sales pipelines.
ROI validates the business case for transformation. When Commerce Cloud replaces legacy ordering systems or manual processes, track the financial benefit versus cost across licensing, services, and internal time saved.
ROI insights help CFOs justify future Salesforce expansions, such as adding Order Management or Service Cloud.
ROI = (Benefit Gained - Cost of Investment) ÷ Cost of Investment × 100
A successful B2B commerce platform doesn’t replace sales reps - it makes them more effective. Measure how many quotes, deals, or follow-ups each rep handles post-implementation compared to before.
With Salesforce, productivity gains often come from unified data, automated quote generation, and real-time pricing visibility.
This KPI captures how synchronized marketing and sales are on buyer personas, messaging, and KPIs. Regular surveys or workshops within Salesforce can measure perceived alignment and identify disconnects between campaign leads and sales outreach. High alignment reduces friction and accelerates deal closure rates.
Automation and integration are key Commerce Cloud advantages. Tracking the average time from order placement to shipment measures how well ERP, OMS, and warehouse systems work together. Reduced processing time directly improves customer satisfaction and cash flow.
Processing Time = Shipment Time - Order Placement Time
Beyond satisfaction, NPS indicates advocacy - how likely customers are to recommend your company. A rising NPS after Salesforce launch means the digital buying experience has improved trust and reliability. Salesforce Surveys or Marketing Cloud journeys can collect this data seamlessly post-purchase.
NPS = % Promoters - % Detractors
In B2B Commerce, integrations are the backbone: ERP for inventory, CRM for account data, OMS for fulfillment. A high integration score reflects reliable synchronization, minimal data duplication, and accurate cross-system reporting. Tracking integration health ensures scalability as transaction volume grows.
Even the most powerful platform fails without adoption. This KPI tracks how many intended users, admins, sales reps, and service agents actively use Salesforce in their daily workflow. Low adoption signals process misalignment, unclear ownership, or training gaps.
Adoption Rate = Active Users ÷ Total Target Users × 100
After go-live, managers often discover incomplete follow-ups or stalled workflows. Tracking task completion within Salesforce helps identify bottlenecks in approval flows or communication gaps across departments. High completion rates reflect a mature, well-embedded process culture.
Training is a hidden determinant of digital success. This KPI measures how many users have completed onboarding or role-specific training. A 100% completion rate within the first 60 days post-launch usually correlates with faster adoption and fewer support tickets.
Completion Rate = Users Trained ÷ Total Users × 100
Every new platform experiences issues. Tracking average bug resolution time, especially in integrations and customizations, demonstrates IT responsiveness and development maturity. Rapid fixes restore user trust and keep projects on track.
B2B buyers expect simplicity: quick reorders, easy search, clean dashboards. This KPI evaluates how intuitive your storefront and internal tools are. ForteNext often measures this using usability testing sessions and satisfaction surveys, translating results into a composite efficiency score.
Automation determines ROI in Salesforce. Measure how often recurring tasks, approvals, fulfillment updates, and invoice generation are handled automatically rather than manually.
Rising utilization means users trust automation and that processes have stabilized.
Automation Rate = Automated Transactions ÷ Total Transactions × 100
Commerce Cloud operates on a highly reliable infrastructure, but integration layers or custom code can introduce downtime. Tracking uptime ensures operational continuity and safeguards customer trust.
Uptime = (Operational Time ÷ Total Time) × 100
If your business provides support or delivery guarantees, meeting SLAs is critical. Salesforce dashboards can automatically report SLA adherence across case types, giving visibility into response and resolution performance. Consistent adherence reinforces reliability across your partner and customer network.
Volume alone isn’t a problem - backlog is. Tracking how many incidents or tickets are resolved each month provides a clear measure of IT and support capacity. A steady or rising close rate, with fewer reopenings, signals healthy operations.
This KPI complements SLA adherence. TTR measures how quickly issues are fully resolved once reported. Monitoring the accuracy of TTR estimates also helps delivery managers forecast workload and improve service predictability.
Backlog reduction shows whether your team is keeping pace with business demand. Tracking backlog burn-down rates weekly helps prioritize automation, resource allocation, and process redesign. A positive velocity trend post-implementation means Salesforce is freeing up, not consuming, capacity.
True transformation is measured not only by stability but by innovation. This KPI tracks how many new ideas, features, or process improvements emerge from users themselves.
High innovation contribution reflects cultural adoption - when teams stop asking “How does Salesforce work?” and start asking “What else can it do?”
Implementing Salesforce Commerce Cloud is not a single milestone; it’s the foundation of an evolving digital ecosystem. The KPIs above don’t exist in isolation - they interact. For example:
ForteNext helps clients operationalize these interdependencies through connected dashboards, executive scorecards, and quarterly optimization cycles. Our approach ensures that performance data flows seamlessly across teams, turning insights into action.
A Salesforce implementation becomes exponentially more valuable when every stakeholder has visibility into the metrics that matter to them. Below is a breakdown of how ForteNext typically maps the 30 KPIs across executive, operational, and customer-facing dashboards.
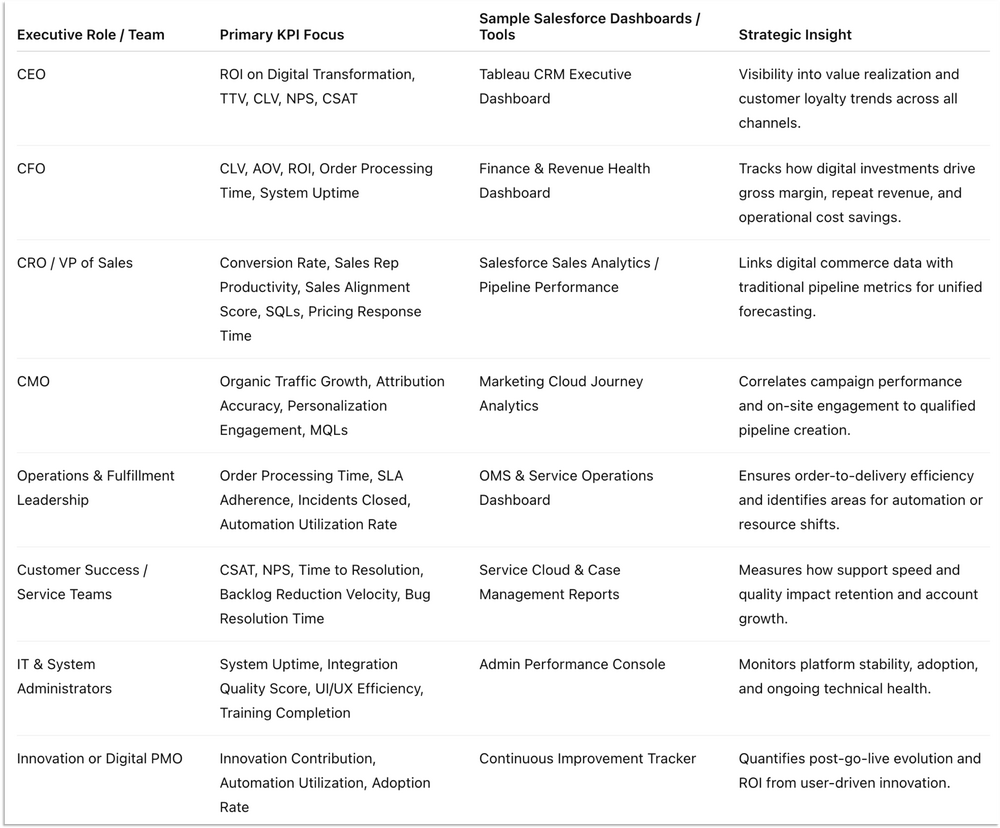
..they are the governance backbone of your Salesforce Commerce Cloud ecosystem. When leadership, sales, marketing, and IT each see performance through their own relevant lens, Salesforce becomes more than a system. It becomes a living, learning platform for continuous growth.
Tracking 30 KPIs can feel overwhelming, but you don’t have to navigate it alone. ForteNext helps B2B organizations turn Salesforce Commerce Cloud data into clear, actionable insights that drive measurable outcomes.
From implementation and integration to dashboard design and performance governance, our consultants build systems that show not just what is happening, but why - and what to do next.

Simon Wright is a B2B demand generation and content strategist with 10+ years' experience across enterprise and ecommerce. He brings a dual perspective; navigating the complexity of B2B and the pace of D2C, to help ambitious organisations turn marketing into a measurable growth engine.


